Radar level meters are widely used across various industrial applications for continuous liquid level and solid level measurement in tanks, silos, and vessels.
They determine the level by transmitting and receiving microwave signals, providing highly accurate and reliable measurement results.
However, to truly understand how a radar level transmitter works, one of the most important things to analyze is its echo curve.
The echo curve contains critical information that helps operators correctly interpret the measurement result, diagnose abnormal conditions, and optimize system performance.
In this article, we will explain what the echo curve means, its key elements, and how it helps in practical industrial applications.
1. Basic Measurement Principle of Radar Level Meters
A radar level meter works by transmitting microwave pulses through its antenna toward the surface of the measured medium.
When the signal reaches the material surface — whether liquid or solid — part of the microwave energy is reflected back to the antenna.
The instrument then measures the time interval between signal transmission and signal reception.
Based on the speed of microwave propagation, the system calculates the distance from the antenna to the material surface and converts it into a level value.
This signal response is visually displayed as an echo curve.
The echo curve provides a direct visualization of how the instrument receives reflected signals inside the vessel.
2. Key Elements of the Echo Curve
Echo Amplitude
Echo amplitude represents the strength of the reflected signal.
The signal strength mainly depends on the reflective characteristics of the measured medium.
For example:
liquids usually generate stronger echoes because the surface is relatively smooth and reflects microwave signals efficiently
solid bulk materials often produce weaker echoes because rough surfaces scatter the signal
In general, a higher amplitude means a clearer and more reliable measurement signal.
Echo Time
Echo time refers to the round-trip travel time of the microwave pulse.
By precisely measuring this time, the instrument calculates the distance between the antenna and the material surface.
This is the fundamental basis for level measurement accuracy.
Multiple Echoes
In addition to the main echo from the material surface, the echo curve may also show multiple reflected signals.
These additional echoes are usually caused by internal reflections inside the vessel.
For example:
agitator blades
tank walls
heating coils
ladders or support beams
nozzle structures
These secondary echoes are extremely useful for diagnosing internal obstacles and interference sources.
3. How to Identify the Main Echo
One of the most important skills in reading an echo curve is identifying the true level signal.
Normally, the main echo has the following characteristics:
highest stable peak
consistent position over time
signal strength significantly above background noise
located at the expected distance range
False echoes usually appear as smaller peaks caused by internal structures.
Modern radar level transmitters often include false echo suppression functions to filter these unwanted signals.
4. Special Operating Conditions
Agitated Tanks
When the vessel contains an agitator, the echo curve may show multiple moving peaks caused by rotating blades.
These echoes may change continuously over time.
Advanced radar instruments can suppress such false echoes to improve measurement accuracy.
Foam or Surface Turbulence
When foam is present or the liquid surface fluctuates significantly, the echo curve may become unstable.
Typical symptoms include:
irregular waveform
increased noise
unstable peak position
Operators should carefully analyze these characteristics to maintain reliable measurement.
5. Importance of Calibration and Verification
To ensure long-term measurement accuracy, radar level meters should be properly calibrated and periodically verified.
Calibration is usually carried out using known reference points, such as fixed tank heights or manual level verification.
The echo curve is not only a signal display — it is also an important diagnostic tool.
By analyzing the waveform, operators can quickly identify:
abnormal signal reflections
internal interference sources
process turbulence
installation issues
This helps improve system performance and measurement reliability in complex industrial environments.
Final Thoughts
The echo curve reflects the complete process of microwave signal transmission and reception inside the vessel.
It provides critical information such as:
echo amplitude
travel time
multiple reflections
false echoes
Understanding how to read the echo curve is essential for improving the accuracy and reliability of radar level measurement systems.
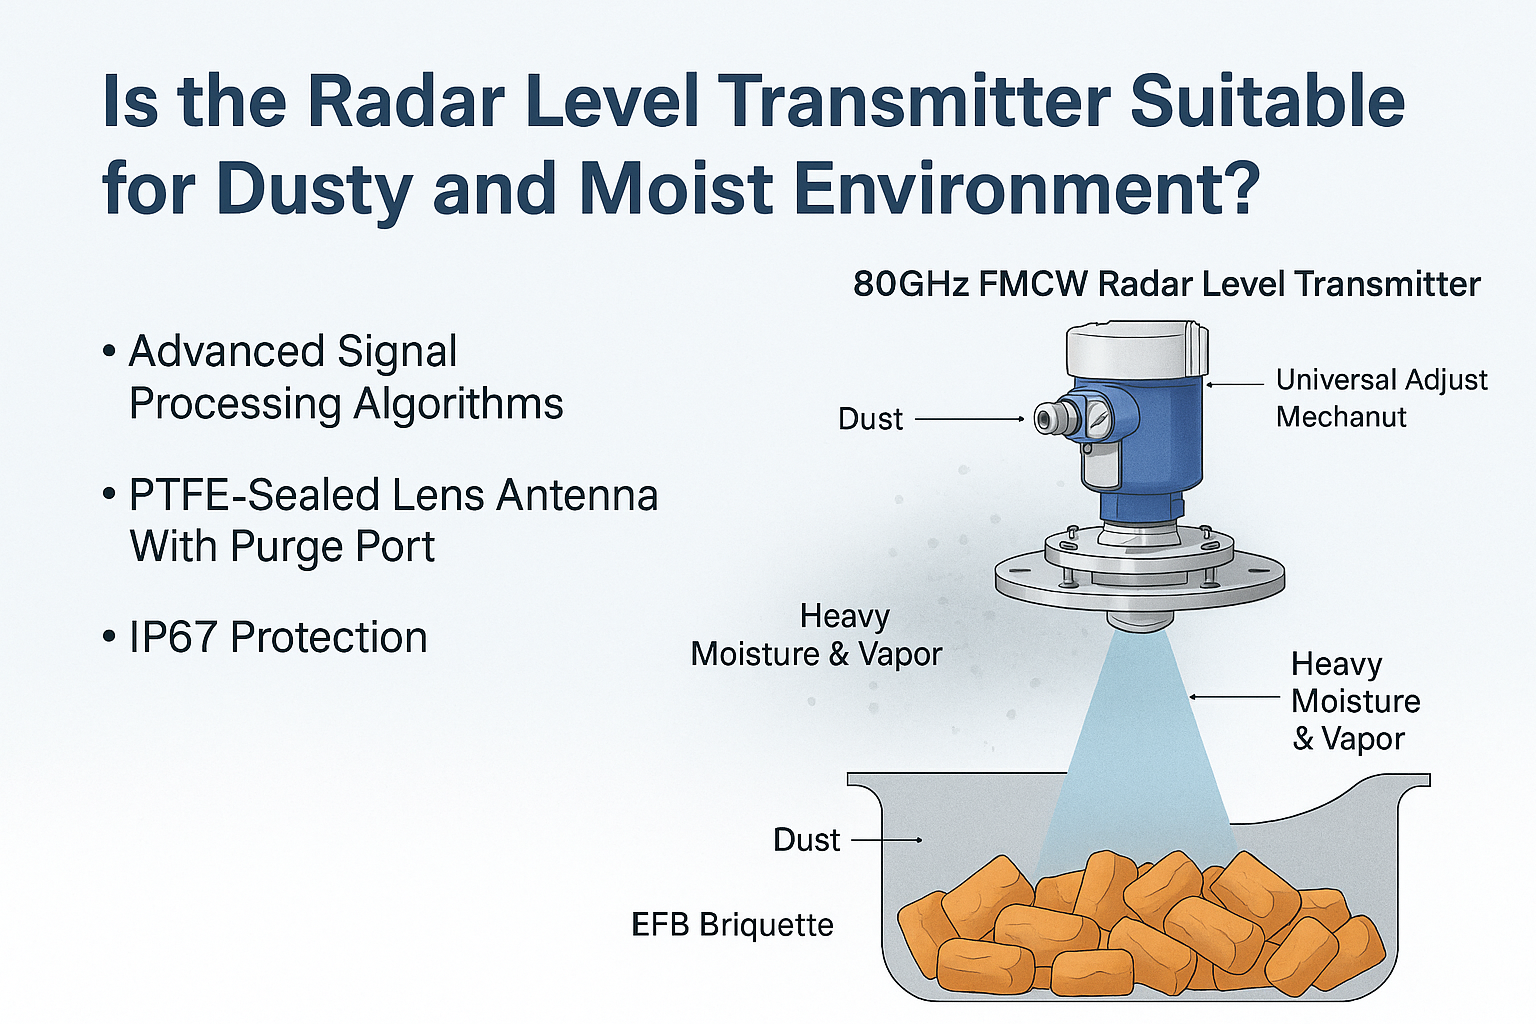
For modern 80 GHz radar level transmitters, advanced echo analysis and false echo suppression functions can significantly improve performance in difficult applications.