Guided wave radar level meters are very important tools in the field of liquid level measurement and are widely used in various liquid level measurement conditions, which require high measurement accuracy. Generally speaking, the way to improve the measurement accuracy is to increase the sampling speed, at the same time the sampling speed increases and the raw data collected by the instrument grows exponentially.
This requires more memory space for the CPU and increases the complexity of the CPU software to process the data, reducing the response time of the instrument. So how can the accuracy of the guided wave radar level be improved through data acquisition and processing methods?
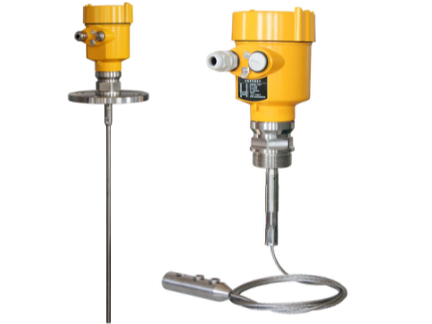
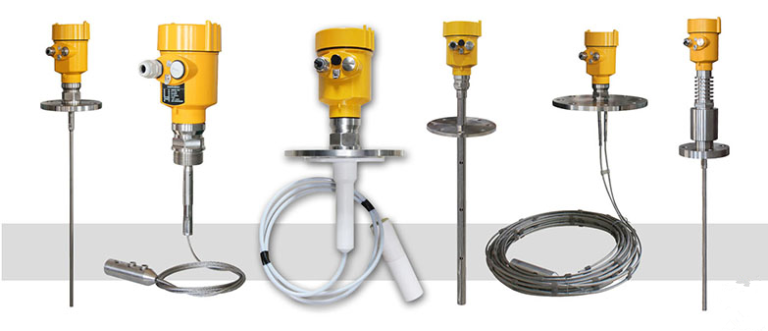
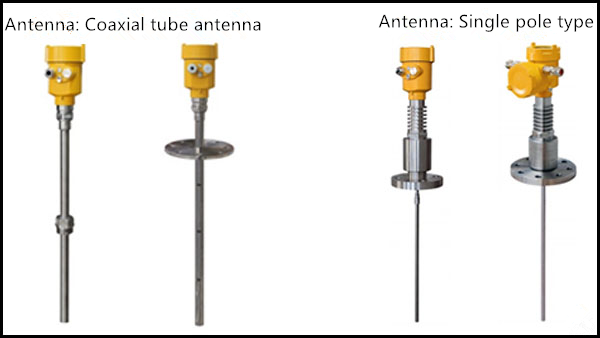
Guided wave radar level meters and pulse radar level meters used for continuous level measurement in industrial automation are commonly used in modern industrial sites.
According to its measuring principle, the last part of the energy is reflected back and sent to the CPU for acquisition after circuit processing, then the intelligent software identifies the valid echoes and calculates the distance from the instrument to the level and then the actual level height. The frequency of the echoes collected by the CPU directly affects the accuracy of the instrument itself.
When software processes the captured raw echoes, different manufacturers and brands have their own methods. The first method uses a fixed frequency sampling rate to capture the raw echoes and then uses a data processing algorithm to distinguish the valid positions of the echoes.
With the first method, if the sampling frequency is low, the instrument itself will have a lower measurement resolution. Conversely, if the sampling rate is high, the CPU will need a large area of RAM to store the acquired waveforms, which will make the CPU significantly more expensive and development costs will increase significantly, while the CPU will take longer to process the data and the real-time performance of the instrument will be reduced.
Another approach is to first sample the raw echo at a relatively low frequency. After sampling the raw echo, a spurious echo is created from the raw echo and the echo curve is calculated from the raw and spurious echoes.
Finding the valid waveform (reflection point) in the waveform is currently sampled at a low frequency and the accuracy of the location of the valid point found is not high. To solve this problem, only valid waveforms are collected at higher sampling frequencies as the location of the valid waveform is currently known, thus increasing the accuracy of the guided wave radar level meter.
The data acquisition and processing method are to use a low-power CPU with its own AD module, DMA module, and timer module. When acquiring waveforms, the TA timer is used to start the timing and begin the AD conversion. After the AD conversion is completed, the DMA is started to transfer data.
First is coarse sampling, sampling the original echo signal at a relatively low sampling rate, using the timer to reach 25K time to generate an interrupt signal to start the AD conversion, the AD conversion completion interrupt flag triggers the DMA to transfer data, and the DMACPU information inside the RAM to the domain, when the amount of data transferred by the DMA reaches 1000, the DMA interrupt completes the data transfer, completing the original echo coarse sampling, giving the data processing flag, the CPU processes the data, generates false echoes, calculates the echo curve, determines the starting point position and the real effective echo position and calculates the delay time required for the starting point and the effective waveform position.
Next, the finely sampled starting position, i.e. the starting position of the original echo signal is sampled at a higher sampling frequency, based on the delay time calculated during coarse sampling, with the delay time in front and the delay time on top, controlling the AD, timing TA, and DMA modules to score 80 points close to the starting point, with a higher sampling frequency. The effective waveform position for fine sampling, i.e. the effective waveform position of the original echo signal is sampled at a higher sampling frequency.
The time selection calculated delay time is delayed first, and after the delay time is over, the AD, timer TA, and DMA modules are controlled to score 80 points near the valid waveform position with a higher sampling frequency. After the acquisition is complete, the data calculation flag is set and the calculation begins.
Finally, the data is calculated, based on the starting point, the valid waveform, and the accumulated delay time, whereby the exact starting point position and the reflection point position of the material are calculated, and the difference between the reflection point position and the starting point position is the corresponding time difference, the reflection distance, and then the actual level is calculated with the corresponding sampling frequency.
In summary, the approximate location of the effective signal space is determined by coarse sampling, when the accuracy is low, and then only this part of the standing wave pattern is acquired by high sampling frequency and the calculation process is carried out. The measurement accuracy of the instrument is improved without increasing the amount of data collected too much. Overall, the use of coarse and fine sampling reduces the amount of CPU calculation tasks and greatly improves the instrument’s response time and measurement accuracy.