Scope: open-channel/current meters, insertion velocity probes, electromagnetic/ultrasonic velocity sensors used in water resources, environmental monitoring, and industrial processes.
1) Why calibration is essential
Eliminates drift: Sensors age; electronics drift; mechanical parts wear; ambient conditions change. Calibration removes systematic error so readings remain traceable to national/industry standards.
Protects decisions: Discharge calculations, compliance reports, and control loops all rely on velocity accuracy; bad data = wrong flow, wrong dosing, wrong alarms.
Meets audits & contracts: Many QA programs (ISO/IEC 17025–based systems, project specs) require documented, periodic calibration and as-found/as-left data.
Reduces lifecycle cost: Early detection of bias prevents mis-operation, re-sampling, and penalties.
Target performance indicators: zero offset, span error, linearity, repeatability, response time, and environmental stability (temperature/humidity).
2) Typical calibration & verification methods
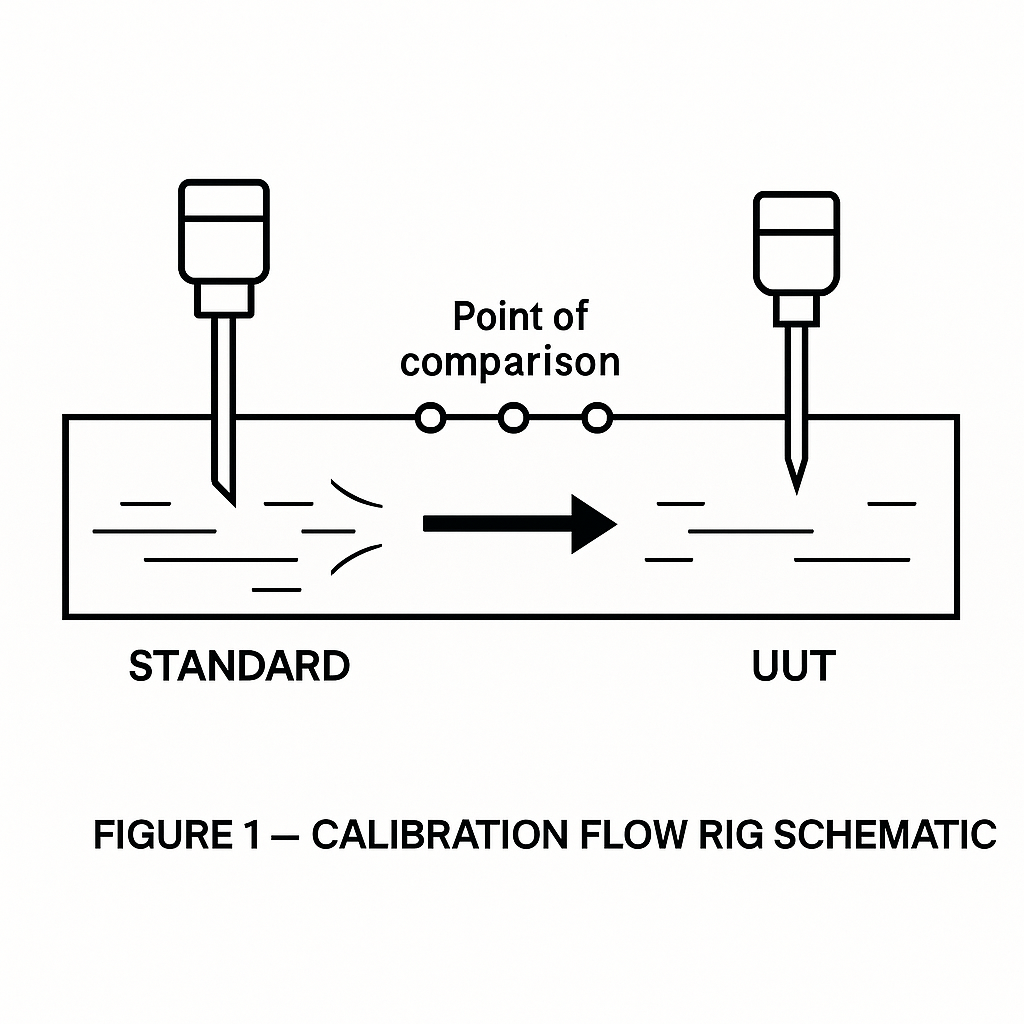
Laboratory calibration on a standard rig Compare the unit under test (UUT) against a traceable standard in a controlled flow facility for multiple points across the range. Highest accuracy; requires dedicated equipment.
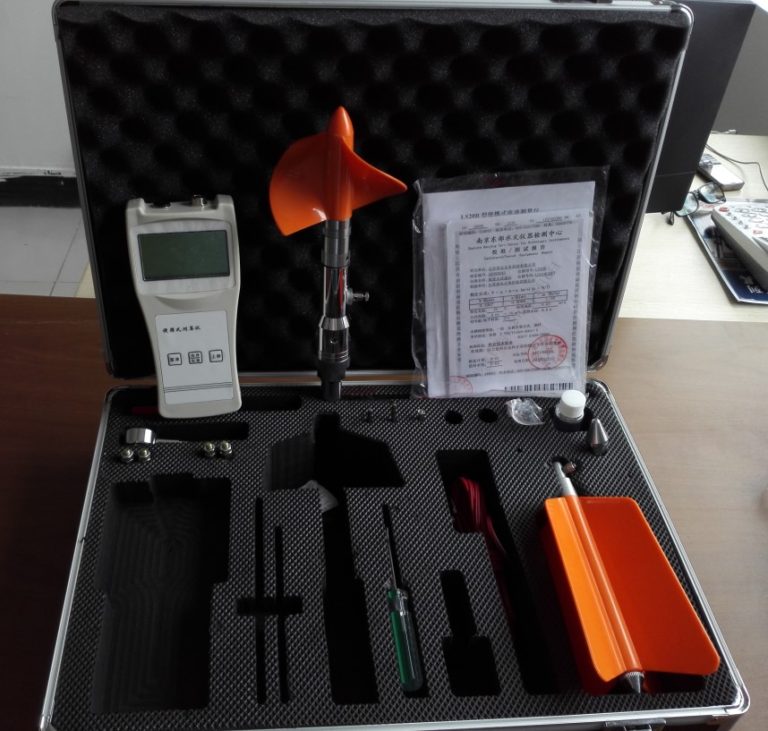
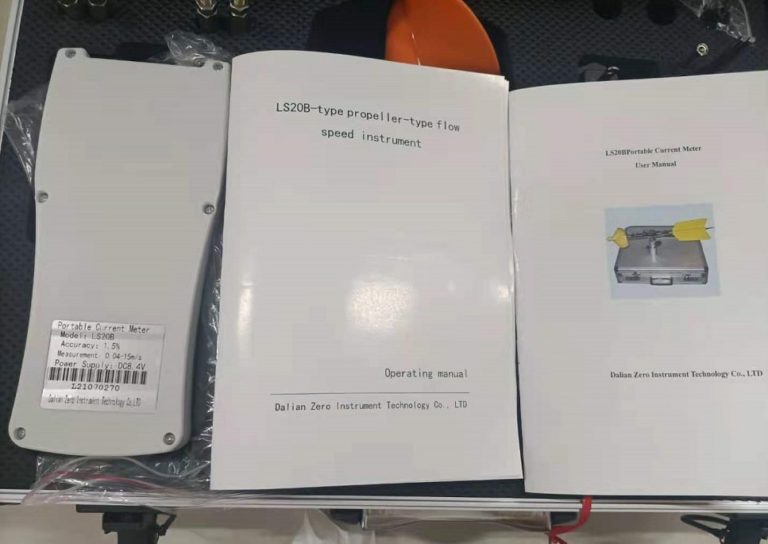
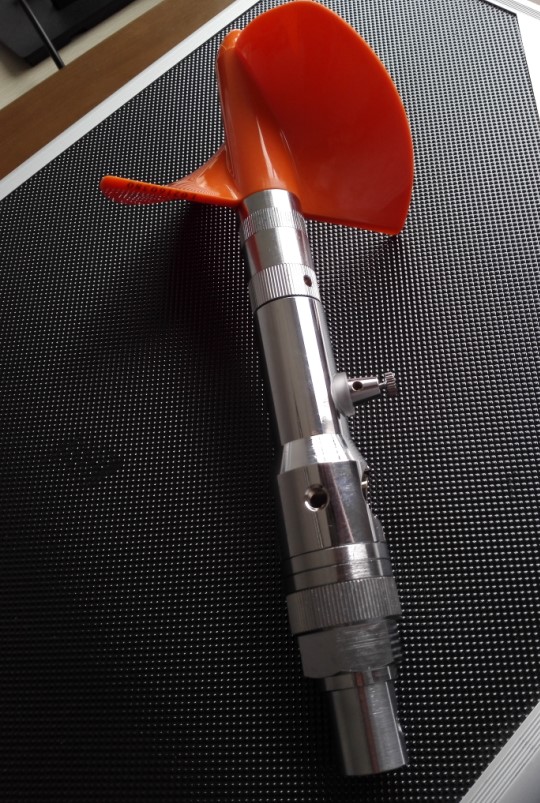
On-site side-by-side comparison Run a certified portable reference velocity meter simultaneously with the UUT in the same profile/section. Ideal for large/installed systems that can’t be removed.
Sensor characterization tests Check sensitivity, linearity, repeatability, and zero in fixtures; confirm response time under step changes.
Electronics/IO verification Stimulate the signal chain; verify acquisition, processing, display, and outputs (4–20 mA, pulse, RS-485) for accuracy and stability.
Recommended calibration point set (example)
Zero → 10% → 25% → 50% → 75% → 90% → 100% of full scale (both upscale and downscale to capture hysteresis).
3) What to include in a complete calibration
Zero (offset) calibration
Span (range) calibration
Linearity test (full-range multi-point)
Repeatability test (≥3 repeats at 3–5 points)
Response time test (10–90% or T63)
Environmental checks (temperature/humidity influence if applicable)
4) Calibration interval (how often?)
General rule: every 6–12 months, adjusted by use frequency, criticality, and environment.
Recalibrate immediately if:
The instrument was repaired or adjusted;
Abnormal readings appear or QA flags a data shift;
The unit experienced shock/rough handling or harsh conditions.
5) Field checklist (quick pass/fail before sending to a lab)
Site condition stable (depth/profile not changing rapidly).
Sensor clean; no fouling/bubbles on transducers; cables intact.
Reference meter within its own calibration validity.
IO sanity check: 4–20 mA loop, pulse scaling, and RS-485 address/baud verified.
Record water temperature (affects some ultrasonic/electromagnetic measurements).
Log as-found data at all points before adjustments; then log as-left.