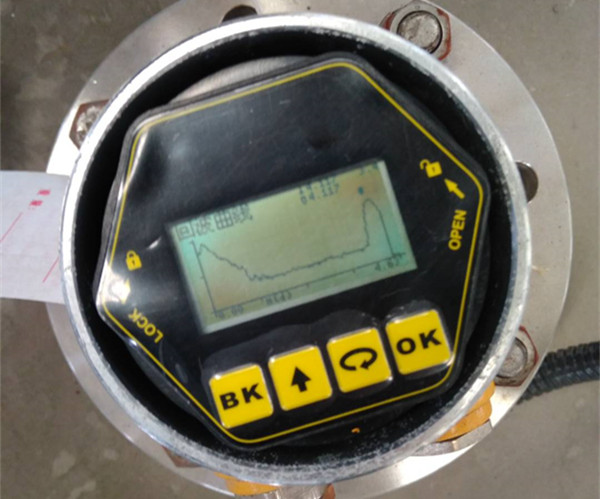
Many partners may not know that reading the echo curve of the radar level meter can get a lot of effective information, so today I will briefly give you an analysis of what kind of state the echo curve can reflect the problem.
The principle of the radar level meter is that its antenna emits narrow microwave pulses, which are transmitted downward by the antenna. After the microwave touches the surface of the measured medium, it is reflected back and received by the antenna system again, and the signal is transmitted to the electronic circuit part to be automatically converted into a level signal.
And the echo curve is the signal, just because the radar level meter is using the radar antenna to transmit and receive the microwave, so this process of receiving the signal is called the echo curve. We can read a lot of information from the echo curve, here’s a look.

Generally speaking, when the echo curve of the radar level meter is divided into two lines and one is smooth and one fluctuates more, it is because there are water droplets on the antenna and the material level is low.
The return curve appears small fluctuation value in the first period, and smooth fluctuation in the later period, this situation is because there are attached materials on the antenna.
When the return curve fluctuates more in the first period and has an obvious peak value in the later period, this situation is because the installation position is more deviated and installed on the short pipe.
And when the curve is higher in the early stage, and then flat and straight down, there is no obvious peak type, this is because the radar level meter anti-corrosion cover has water, and the material level is higher at that time.
