1. Quick Fault Location & Visual Identification of Abnormalities
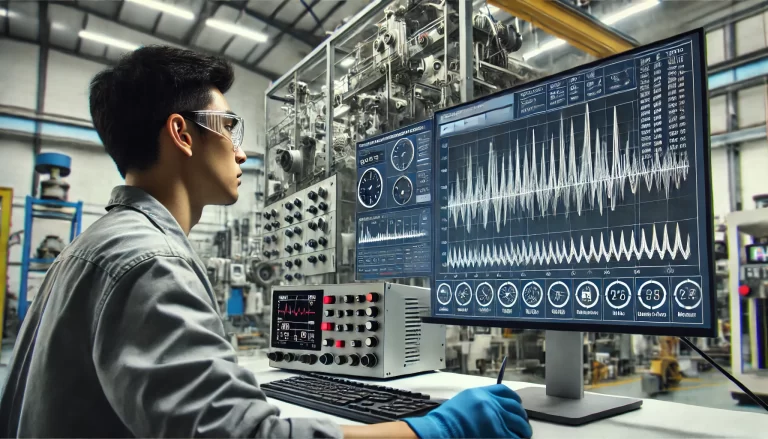
Instrument curves provide a clear, visual representation of how the measurement values change over time or with other variables. Under normal conditions, these curves should exhibit a relatively stable trend or follow a predictable pattern. However, when a fault occurs, the curve will often display abnormalities, such as sudden fluctuations, jumps, or constant values. These irregularities allow maintenance personnel to quickly identify and locate the problem, facilitating a swift response to the issue.
For example, a sudden spike or drop in a curve could indicate a sensor failure, whereas a flat, unchanged curve might suggest a signal transmission issue.
2. Differentiating Fault Types
Different types of instrument faults exhibit distinct characteristics in the curve patterns. By analyzing the shape and behavior of the curve, technicians can differentiate between various types of faults. Some common fault signatures include:
- Sensor Failure: The curve may exhibit random noise or data gaps.
- Signal Transmission Failure: The curve may show sudden interruptions or irregular jumps.
- Circuit Faults: The curve might become fixed at a certain value or show slow, unusual changes.
By closely examining these curve features, technicians can quickly diagnose the fault type and focus on specific areas for investigation.

3. Analyzing Fault Causes and Tracing the Development Process
Reviewing historical curves is invaluable in understanding how a fault developed over time. Technicians can track the behavior of the instrument before the fault occurred, identifying trends or abnormalities that led up to the failure. For example, if a curve gradually deviated over time, it might indicate a slow deterioration due to wear and tear, while a sudden spike could be caused by an external interference.
This historical analysis allows for a more accurate understanding of the fault’s cause and helps technicians prioritize repairs.
4. Revealing Correlated Factors
Many instruments measure variables that are linked to other process parameters or environmental factors. By examining related parameter curves and their interactions, technicians can identify if the fault originated from an external factor. For instance, in chemical production, a temperature instrument’s abnormal curve might correlate with fluctuations in pressure or flow rate, suggesting that the issue could stem from an interconnected system rather than just the temperature sensor itself.
Comprehensive curve analysis helps identify potential root causes, providing a broader view of the instrument’s performance in the context of the entire system.
5. Verifying Repair Effectiveness & Confirming Normal Operation
After performing maintenance or adjustments on an instrument, reviewing the curve is a straightforward method of confirming whether the instrument has returned to normal operation. A properly functioning instrument should produce curves that reflect stable and accurate measurements, consistent with the typical performance of the system.
If the curve still displays anomalies, it indicates that the issue might not have been fully resolved, and further investigation or adjustments may be necessary.
6. Assessing Performance Indicators
In addition to confirming that the instrument is functioning correctly, curves can be used to assess performance indicators, such as accuracy, response time, and stability. By analyzing the amplitude of fluctuations, the rise and fall times, and overall trend stability, technicians can determine if the instrument meets performance specifications.
For example, if a flowmeter’s curve exhibits excessive oscillation, it could indicate issues with stability, or if response times are too slow, it may suggest a need for calibration.
7. Predicting Potential Failures and Identifying Early Signs
Even if the instrument appears to be functioning properly, long-term monitoring of curves can reveal subtle signs of impending failure. Small deviations or fluctuations in the curve may not affect current performance but can signal that the instrument is beginning to degrade. Early detection of these minor issues enables proactive maintenance, preventing larger, more costly failures down the line.
8. Implementing Preventive Maintenance
By continuously analyzing curves and identifying early warning signs of faults, maintenance teams can create a preventive maintenance plan. This approach includes replacing worn-out components, cleaning, and recalibrating the instrument before a failure occurs. Preventive measures not only reduce downtime but also extend the lifespan of equipment and improve overall system reliability.
Conclusion
In conclusion, reviewing instrument curves is a crucial part of fault diagnosis, providing vital information at each stage of troubleshooting. From early fault detection and fault type differentiation to cause analysis and performance verification, curves serve as a key tool for technicians. By incorporating curve analysis into regular maintenance practices, companies can enhance fault diagnosis efficiency, prevent costly downtime, and ensure the continued reliability of their instruments and entire production systems.