Abstract
Small-signal cutoff is an essential technique in industrial flow measurement used to suppress erroneous readings caused by zero drift, noise, and non-ideal process conditions.
Although the phenomenon is common across all flowmeter types, the mechanisms that generate small signals differ significantly depending on measurement principle, instrument quality, environmental factors, and installation conditions.
Appropriate cutoff configuration therefore requires both technical understanding and on-site judgment.

1. Introduction
Small-signal cutoff is widely applied in flow instrumentation to prevent undesirable effects caused by zero drift and weak signal disturbances.
A practical case illustrates the importance:
A thermal power plant supplied steam to an industrial user through a large pipeline. A standard orifice flowmeter was installed with a 0–160 t/h range. During full production, the meter operated normally. When the main production unit was shut down, the flow indication dropped to zero—even though residential usage (cooking, washing, staff facilities) should have consumed approximately 10 t/h.
Investigation revealed a factory-fixed cutoff at 8.7% of full scale (13.9 t/h). Any actual flow below this was forced to zero.
Replacing the original instrument with a smart silicon pressure transmitter and configurable flow computer allowed a lower cutoff point to be set. The plant recovered its previously unaccounted steam losses, restoring fairness to both supplier and consumer.

2. Small-Signal Effects in Differential Pressure (DP) Flowmeters
DP flowmeters are historically the most widely used and the first to adopt cutoff techniques.
2.1 Background
Early mechanical DP measurement relied on U-tubes, bellows, and float-type indicators, which could not mathematically suppress drift. Operators manually compensated by frequent zero checks.
With the advent of electronic DP transmitters and signal processing, zero drift could finally be masked using cutoff.
2.2 Square-Root Relationship and Instability
DP flow obeys the characteristic relationship:
q ∝ √ΔP
At very low flow rates, the slope of this curve approaches infinity, leading to large errors from small ΔP fluctuations.
Historically:
1.5% DP drift → ~12% equivalent flow error
Instruments were recommended not to display below 30% FS, implying a 3:1 turndown
Modern DP transmitters with 0.2–0.075% accuracy enable much lower cutoff values:
Legacy DP: 1% ΔP → ~10% FS flow
Improved systems: 0.75% → ~8.7%
Integrated compact DP flowmeters: ≈2% of qmax
Thus, manufacturing and signal-processing advances steadily reduce the required cutoff threshold.
3. Interpretation of Small-Signal Cutoff Across Flowmeter Types
3.1 Electromagnetic Flowmeters
Primary causes of zero instability:
Electrode fouling/film insulation
Conductivity fluctuations
Noise or EMI
Analog stage drift
Partially filled pipe or pulsating liquid columns
Most electromagnetic meters operate reliably with cutoff around 1% FS.
3.2 Vortex Flowmeters
Although vortex meters theoretically output no pulses below the minimum Reynolds number, they remain vulnerable to:
Pipe vibration
Mechanical resonance
RF interference
When the vortex frequency approaches zero, amplifier gain is maximized, making the meter most susceptible to noise.
Cutoff prevents false counting in this region.
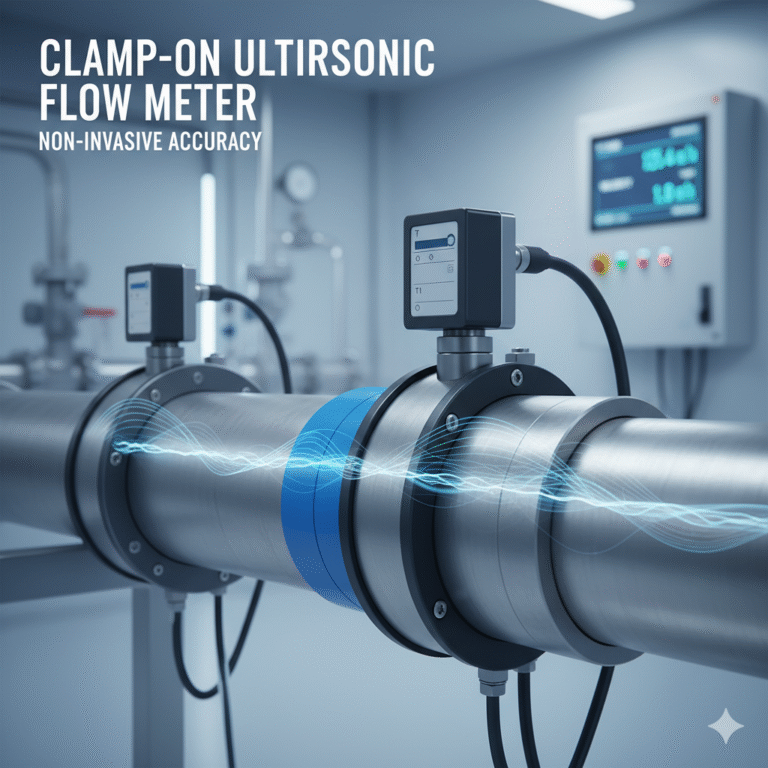
3.3 Ultrasonic Flowmeters (Transit-Time)
When flow is zero, upstream/downstream travel times should be equal.
However:
Transducer mismatch
Aging, temperature drift
Electronic offset
All introduce apparent flow.
A ~1% FS cutoff is generally sufficient.
3.4 Turbine Flowmeters
Turbine wheels stop below a mechanical threshold, so theoretically no rotation = no signal.
But 4–20 mA analog processing introduces drift, requiring ≤1% FS cutoff.
4. Practical Methods for Implementing Cutoff
4.1 Integrated Software-Based Cutoff
Modern instruments allow:
Selecting cutoff mode
Direct numeric input of cutoff value
Two typical strategies:
Hard zero switch (truncate values below threshold)
Residual output mode (allow slight non-zero indication for drift assessment)
4.2 Post-Processing Cutoff via Flow Computers or Control Systems
Where transmitters lack cutoff functionality, DCS/PLC/flow computers may apply:
Piecewise linear (multi-segment) scaling
Gain suppression in low signal range
Deadband definition for pulse signals
This enables legacy hardware upgrade without equipment replacement.
5. Optimizing Cutoff Settings
Cutoff is a balance between:
✔ masking unwanted noise and drift
✘ avoiding loss of real low-end flow data
Key principles:
Use the smallest cutoff that avoids instability
If zero drift is negligible, avoid cutoff entirely
Severe drift (steam, wet gas, long impulse tubes) requires higher cutoff
Always verify cutoff against field conditions
Vortex meters deserve special attention:
For control: factory preset usually sufficient
For custody transfer: minimize cutoff carefully
In vibration-heavy environments: cutoff must be increased
Adjust in conjunction with gain and trigger level parameters

6. Conclusion
Small-signal cutoff is not a flaw in measurement—it is a necessary engineering tool for ensuring reliable indication in the presence of noise, drift, and uncertain zero conditions.
Because:
Flowmeter types differ in drift mechanisms,
Process conditions vary significantly,
Installation quality and media properties affect zero stability,
There is no universal cutoff setting.
The optimal cutoff resides at the intersection of measurement requirement and achievable minimum flow, determined through field commissioning and verification.