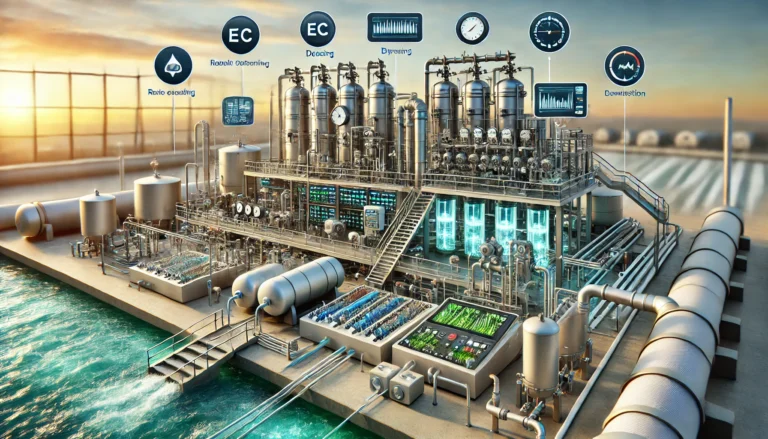
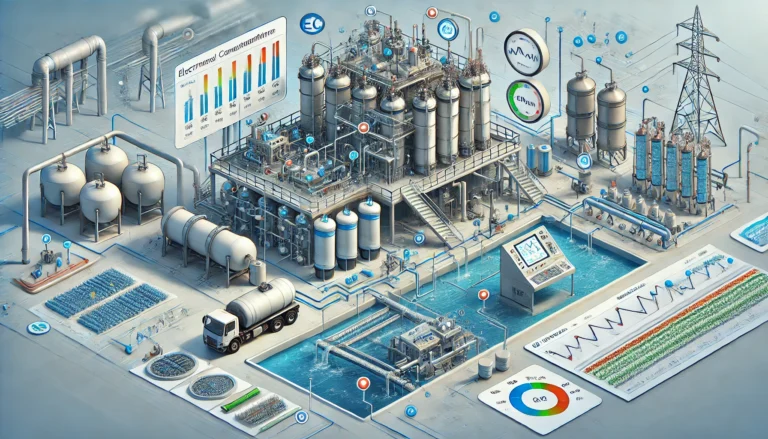
Electrical conductivity (EC) is an essential physical parameter used to characterize the ion concentration and soluble inorganic salt content in water solutions. It is widely applied in industrial wastewater treatment, reverse osmosis (RO) and ultrapure water systems, cooling water management, municipal wastewater plant process control, and environmental discharge regulation.
Unlike experimental water quality indicators such as pH, COD, and ammonia nitrogen, EC features quick response time, continuous monitoring capability, and integration with control systems, making it indispensable for process monitoring in industrial scenarios.
In many industrial systems, EC is used not only as a water quality parameter but also as a process control variable. It triggers automatic dosing, bypass switching, membrane cleaning, valve interlocking, and more. Therefore, EC can be viewed both as a “water quality parameter” and a “control variable.”
I. Definition and Measurement of Electrical Conductivity
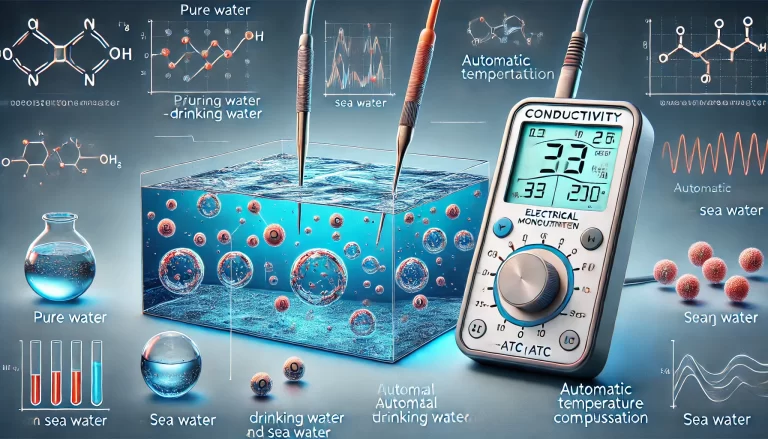
Electrical conductivity refers to the ability of a solution to conduct electricity, measured in μS/cm or mS/cm. It is influenced by factors such as ion concentration, ion valence, ion mobility, and temperature. Pure water does not conduct electricity; its conductivity comes from dissolved cations (e.g., Na⁺, Ca²⁺, NH₄⁺) and anions (e.g., Cl⁻, SO₄²⁻, NO₃⁻).
For comparability, the standard EC is referenced at 25°C, with most instruments using automatic temperature compensation (ATC). The temperature correction formula is typically:
Where
is the temperature coefficient, usually between 1.7%–2.2%/°C, depending on the solution type.
II. Relationship Between EC and Other Parameters
| Parameter | Relationship with EC | Industrial Application |
|---|---|---|
| TDS (Total Dissolved Solids) | Approx. , at 25°C | Quick estimation of wastewater salinity |
| Salinity |
, in seawater | Seawater desalination, seawater intrusion studies |
| Resistivity |
(μS/cm) | Semiconductor, pharmaceutical, ultrapure water systems |
| Ion Exchange Load | Higher EC means more resin load | Softening, EDI, mixed-bed system design |
| Desalination Rate | For RO/NF systems:
| Membrane performance evaluation, membrane failure diagnosis |
III. EC Ranges for Water Types and Processes
| Water/Process Type | EC Range (μS/cm) | Industrial Significance |
|---|---|---|
| UPW (Ultrapure Water) | 0.055 (18.2 MΩ·cm) | Any increase indicates system leakage or ion contamination |
| Pharmaceutical Water | ≤ 1.3 | Direct impact on GMP compliance |
| EDI Product Water | 0.5 – 1.0 | Indicates resin/membrane performance degradation |
| RO First-stage Product Water | 5 – 50 | Increase in EC indicates membrane fouling or breakage |
| Municipal Tap Water | 200 – 1200 | Affects membrane operating pressure and anti-scaling agent dosage |
| Municipal Wastewater | 800 – 2500 (normal) | > 4000 may inhibit nitrification |
| High-Salinity Industrial Wastewater | 5000 – 50000+ | Requires chemical desalination, evaporation, crystallization |
| Seawater | 45000 – 55000 | EC directly correlates with salinity |
IV. Industrial Application Examples
RO Membrane System Failure Diagnosis
In a food industry reverse osmosis system, the influent EC was 950 μS/cm, and the product water EC was 35 μS/cm (96.3% desalination rate). After 18 months of operation, the product water EC rose to 180 μS/cm, with no significant change in flow rate. The desalination rate dropped to 81%, indicating membrane damage, specifically a pinhole. This failure was first detected through EC, highlighting its efficiency in real-time monitoring.Impact of Salt Shock on Biological Systems
A municipal wastewater treatment plant had an influent EC of < 2500 μS/cm. One day, EC rose from 1800 to 5200 μS/cm without significant changes in pH or COD. Hours later, nitrification rate dropped by 65%, with nitrite accumulation. The EC spike indicated a salt shock, exceeding the tolerance of nitrifying bacteria (EC ≈ 4500–5000 μS/cm). Measures were taken to bypass the influent, dilute the tank, and add alkali to restore normal operation.Identification of Illegal Discharge in Industrial Parks
In an industrial park, the normal EC of the pipeline network was about 1200 μS/cm. One night, a point monitoring system detected a spike to 9200 μS/cm. By comparing EC gradients at multiple monitoring points, the source of the pollution—a discharge of untreated acid-washing wastewater—was traced, demonstrating the rapid response capability of EC for law enforcement.
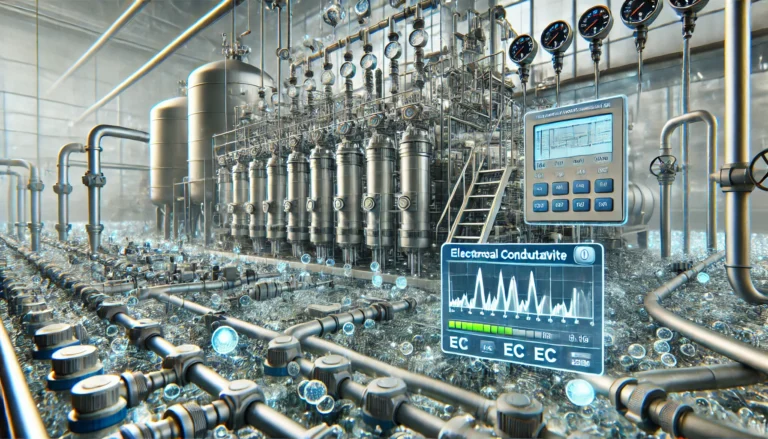
V. Applications of Electrical Conductivity
EC is commonly used in real-time monitoring systems like PLC, DCS, and SCADA to:
| Control Method | Typical Applications |
|---|---|
| Threshold Alarms | High salt impact warning, membrane limit alarms |
| PID Closed-loop Control | Dosing control for scale inhibitors, acid/base neutralization |
| Process Switching | Automatic bypass for high EC, dilution of tanks, stopping influent |
| Quality Assessment | Determining RO water quality, water reuse compliance |
| Automatic Reporting and Trend Analysis | Error troubleshooting, audit trail, emission tracing |
EC signal outputs can include 4–20 mA, Modbus RTU, Profibus, Ethernet/IP, etc.
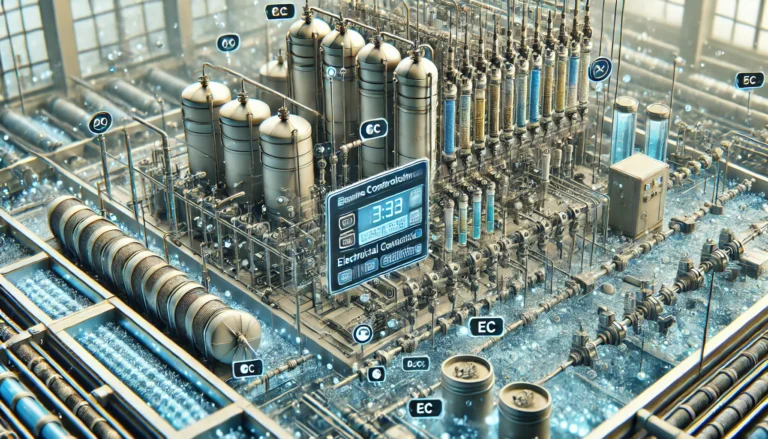
VI. Electrode and Instrument Selection for EC Measurement
| Type | Advantages | Common Range | Typical Uses |
|---|---|---|---|
| 2-Electrode | Low cost, suitable for low EC | 0 – 5000 μS/cm | Pure water, general tap water |
| 4-Electrode | Anti-polarization, wider linear range | 0 – 200,000 μS/cm | Industrial wastewater, RO concentrate |
| Inductive (Non-contact) | No electrode contact, resistant to fouling | 0.1 – 2000 mS/cm | High salinity, high viscosity media |
| Resistivity Meters | High precision, measures ultra-low EC | 0.055 – 1 μS/cm | Ultrapure water, semiconductor/pharmaceutical industries |
Key selection criteria include range, temperature tolerance, media corrosiveness, and presence of suspended solids or bubbles.
VII. Common Misconceptions in EC Monitoring
| Misconception | Correct Explanation |
|---|---|
| “Lower EC is always better.” | True for ultrapure water, but not necessarily for wastewater or reclaimed water. |
| “TDS meters are the same as EC meters.” | TDS meters are simple, single-point conversion devices, not accurate enough for industrial control. |
| “EC doesn’t change before COD exceeds limits.” | In many cases, especially with high-salinity or acidic/alkaline pollution, EC changes before COD. |
| “EC anomalies always indicate water quality issues.” | EC may change due to temperature compensation errors, instrument malfunction, or changes in dosing, so cross-verification is needed. |
VIII. Conclusion
Electrical conductivity, as a real-time online parameter, offers significant advantages in industrial water treatment systems:
Fast response and continuous monitoring → Provides early warnings of pollution, equipment failures, or process fluctuations before they escalate.
Can serve as a control signal → It can be linked to dosing systems, valves, bypasses, and alarms for proactive intervention.
Versatile for multiple water types → From ultrapure water to high-salinity wastewater, EC is applicable across various systems.
Critical in membrane system monitoring, ion leakage, and salt shock detection → It directly correlates with key processes.
Useful for law enforcement and traceability → Quickly identifies discharge points and areas of abnormal discharge.
Thus, EC should be considered a primary parameter rather than a secondary monitoring tool in the design, operation optimization, and safety control of industrial water systems.