Analysis of Sudden Flow Drop in Ultrasonic Flowmeters - Just Measure it

Analysis of Sudden Flow Drop in Ultrasonic Flowmeters

Abstract

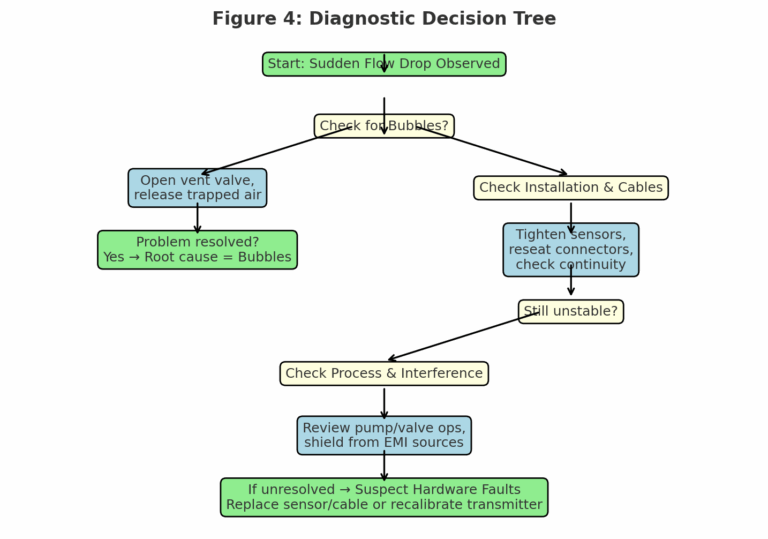
During ultrasonic flow measurement, users may occasionally observe a sudden drop in the indicated flow rate, followed by recovery within 2–3 seconds. While pipeline bubbles are a common cause, they are not the only factor. This document systematically analyzes the potential causes, provides diagnostic methods, outlines step-by-step troubleshooting, and summarizes real-world case studies.

1. Principle-Based Cause Analysis

Ultrasonic flowmeters measure flow velocity by detecting the time difference or frequency shift of ultrasound propagation through the fluid. Any factor that interferes with ultrasound transmission or fluid stability may cause a sudden measurement anomaly. Causes can be grouped into three categories:

1.1 Fluid Condition Abnormalities (Most Common)

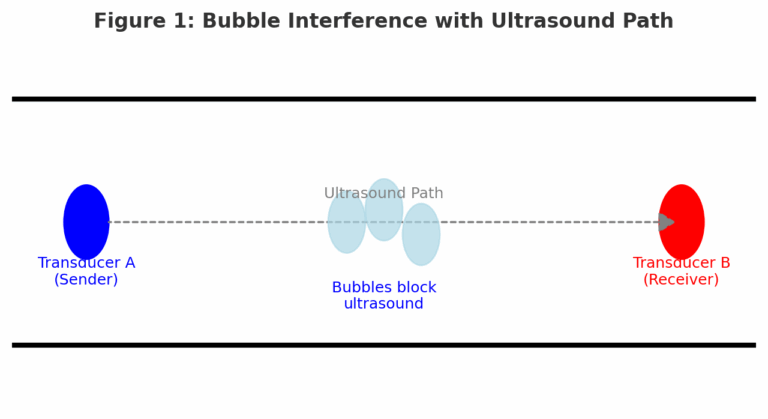
  • Bubbles in the pipeline

    • Phenomenon: Ultrasound signal weakens or is blocked → sudden flow drop → normal recovery after bubbles pass.

    • Typical sources: Air trapped at pipeline high points, pump suction leaks, gas release due to pressure drop/temperature rise.

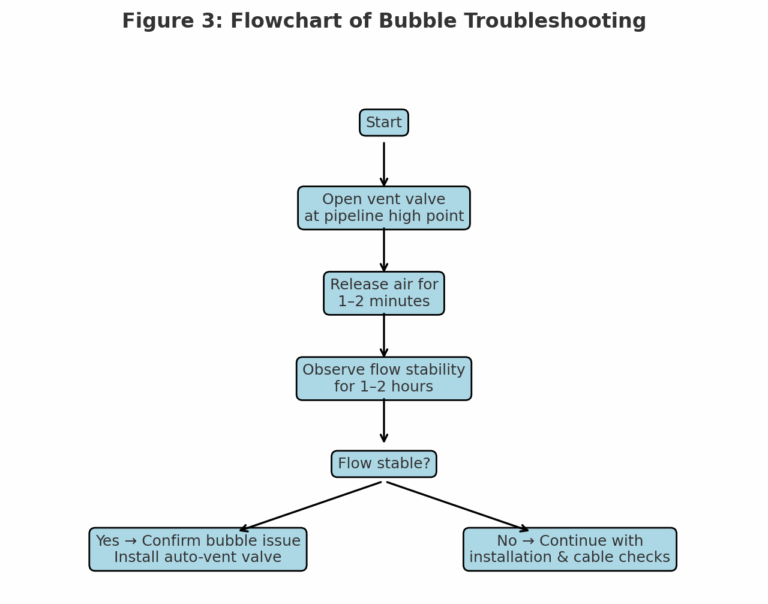
    • Diagnostic: Observe signal strength (e.g., drop from 80% to <30%), check vent valves, inspect for gas pockets.

  • Transient flow interruption or velocity fluctuation

    • Phenomenon: Gradual flow decrease and recovery (unlike sharp bubble effect).

    • Diagnostic: Correlate with upstream valve/pump operation; review stored velocity trend curves.

  • Non-uniform medium (impurities/phase separation)

    • Phenomenon: Solid-liquid mixtures or oil-water stratification disturb ultrasound propagation, causing short-term deviations.

    • Diagnostic: Check for visible impurities; correlate with medium replacement or feed changes.

1.2 Installation or Hardware Faults

  • Sensor misalignment due to vibration

    • Loose or shifted sensors change acoustic path → temporary signal loss.

    • Diagnostic: Inspect mounting bolts, recalibrate spacing and angle.

  • Cable/connection faults

    • Poor contact or intermittent disconnection under vibration.

    • Diagnostic: Wiggle cables to replicate issue; replace with spare cable for verification.

  • Transmitter malfunction

    • Power supply fluctuations or temporary CPU freeze.

    • Diagnostic: Check power indicators; compare event timing with power system logs.

1.3 External Interference

  • Electromagnetic disturbance from nearby equipment (e.g., VFDs, welding machines).

  • Diagnostic: Correlate with operation of large equipment; test with shielded cables and improved grounding.

2. Step-by-Step Troubleshooting Workflow

Recommended diagnostic sequence (from easy to advanced):

  1. Step 1: Bubble elimination (highest probability)

    • Action: Open vent valve at pipeline high points for 1–2 minutes.

    • Verification: Monitor flow stability after degassing.

    • [Figure 3: Flowchart of Bubble Troubleshooting]

  2. Step 2: Installation and contact checks

    • Tighten sensor bolts, reseat connectors, test cable continuity.

    • Verification: Observe for 1 hour to confirm stability.

  3. Step 3: Process and interference verification

    • Cross-check with upstream operations and large equipment start/stop.

    • Test with shielded cabling or equipment isolation.

  4. Step 4: Hardware replacement & calibration

    • Replace with spare sensor/cable; if unresolved, request manufacturer field calibration.

3. Summary

  • Bubbles are the most frequent cause, but must be verified with venting tests.

  • If unresolved, proceed in order: installation → cable → process/interference → hardware.

  • Preventive measures include:

    • Installing automatic vent valves,

    • Using shielded wiring and proper grounding,

    • Regular inspection of sensor mounting and probe cleanliness.

4. Case Studies

Case 1 — Sensor Misalignment

  • Phenomenon: ±15% error in slurry measurement.

  • Cause: Sensor axis misaligned by 5°.

  • Solution: Realigned sensors → measurement stabilized.

  • [Figure 5: Correct vs. Incorrect Sensor Alignment]

Case 2 — Accumulator Overflow

  • Phenomenon: Flowmeter displayed 0.00 kg/s with error code “E14.”

  • Cause: Cumulative totalizer overflow due to small unit/pulse factor.

  • Solution: Reset accumulator, adjust calibration factor → normal display restored.

Case 3 — Probe Contamination

  • Phenomenon: Inaccurate gas flow readings.

  • Cause: Dust, rust, and moisture buildup on probes.

  • Solution: Probe cleaning restored accurate measurement.

5. References

  • Manufacturer technical manuals.

  • Field troubleshooting reports from chemical, gas, and water industry applications.

Share This Story, Choose Your Platform!

Contact Us

    Please prove you are human by selecting the plane.
    Translate »