Radar level meters are critical instruments used in various industries to monitor material levels in storage containers. They work by transmitting and receiving microwave signals to measure the position of the medium’s surface, providing precise level data. A deep understanding of radar level meters requires careful analysis of their echo curves, which contain essential information for both correct interpretation and effective use. This article explains the meaning behind the echo curves generated by radar level meters, exploring the key components and factors affecting them.
Fundamentals of Radar Level Measurement
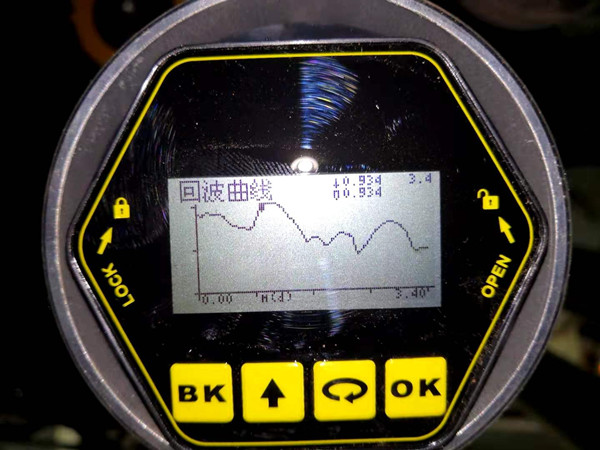
A radar level meter operates by emitting microwave pulses from an antenna. When these pulses encounter the surface of a material (liquid or solid), part of the signal is reflected back and received by the same antenna. The time interval between signal emission and reception allows the system to calculate the distance to the medium’s surface, and therefore, determine the material level. This entire process results in the creation of an echo curve, which visualizes the system’s response.

Key Elements of an Echo Curve
Echo Amplitude
Echo amplitude reflects the strength of the returned signal. This amplitude depends on the surface reflectivity of the material:- Liquids: Usually produce strong reflections, resulting in high-amplitude echoes since liquids have smooth surfaces that reflect most microwave energy.
- Bulk solids: Generate weaker reflections because of their rough surfaces, which scatter the signal, reducing the echo amplitude.
Echo Time
Echo time corresponds to the round-trip travel time of the microwave pulse. By measuring this time accurately, the system determines the surface’s distance from the antenna, enabling precise level measurements.Multiple Echoes
Besides the primary echo, echo curves may show multiple echoes due to signal reflections inside the container.- Internal Reflections: For example, the pulse might bounce off the medium’s surface, continue to the container’s top, and reflect again. These secondary echoes provide additional information, such as:
- The shape and structure of the container.
- The presence of obstructions or interfering substances.
- Internal Reflections: For example, the pulse might bounce off the medium’s surface, continue to the container’s top, and reflect again. These secondary echoes provide additional information, such as:
Interpreting Special Scenarios in Echo Curves
Radar level meters must handle various operating conditions. The echo curve provides valuable insight into these scenarios, helping operators troubleshoot and optimize measurements.
Stirred Tanks:
If the container has a stirrer, the echo curve might show multiple moving targets, corresponding to the reflections from the stirrer blades.Foam or Surface Fluctuations:
The presence of foam or liquid surface agitation may cause the echo curve to become unstable, resulting in increased noise or irregular patterns. Skilled operators must recognize these patterns to make appropriate adjustments and ensure accurate readings.
Calibration and Verification for Accurate Measurements
To maintain the accuracy of radar level meters, calibration and regular verification are essential. Calibration involves adjusting the instrument parameters against known reference points (e.g., a fixed-height reference) to ensure precise measurements. Periodic checks can also help identify potential problems early, ensuring the long-term stability and reliability of the equipment.
Using Echo Curves for System Optimization
The echo curve is not just a display of measurement data; it serves as a window into the entire measurement process. Through careful analysis, operators can identify abnormalities, system inefficiencies, or interference sources. This allows them to take proactive steps to optimize the system’s performance.
Whether dealing with liquids, solids, or challenging industrial conditions, accurate interpretation of the echo curve is vital for ensuring reliable measurement and optimizing system performance.
Conclusion
In summary, the echo curve of a radar level meter represents the complete process of microwave signal transmission and reception. It carries detailed information, including echo amplitude, time, and secondary reflections, which reflect the conditions inside the container. By understanding and analyzing these curves, operators can enhance their mastery of the equipment, leading to improved measurement accuracy and reliability across various applications.