In industrial processes, instrumentation failures can lead to production interruptions, false alarms, or even safety hazards. However, many failures are misdiagnosed due to neglecting critical contextual factors such as process conditions or environmental influences. This article presents a three-step diagnostic method that combines process analysis with instrument characteristics and field conditions to help engineers quickly and accurately identify root causes.
Step 1: Diagnose Based on Process Conditions
(1) Confirm the Process Operating Status
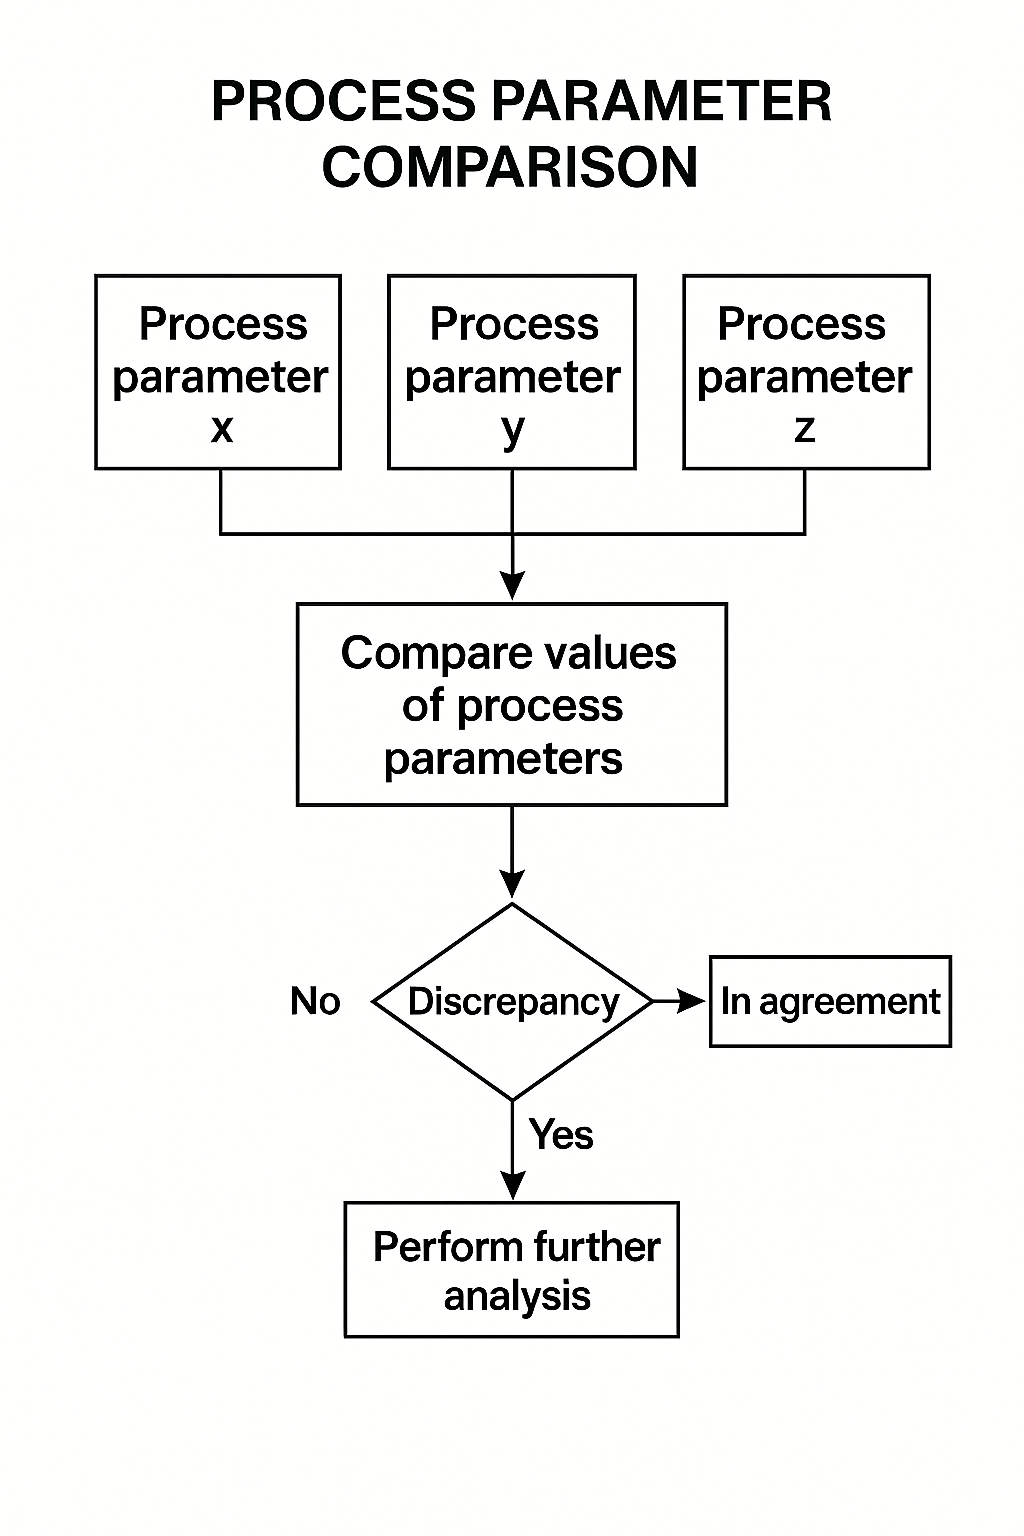
Stable vs. Abnormal Conditions: First, check if flow, pressure, and temperature values are within normal ranges. If process values are abnormal (e.g., a sudden drop in flow rate), the issue may stem from the process itself, not the instrument.
Cross-Reference Instrument Data: Example: If a flowmeter reading is abnormal, compare upstream/downstream pressure, temperature, and valve opening to determine if the issue is related to process fluctuation or the instrument itself.
(2) Analyze How Process Variations Affect Instrumentation
Media changes (e.g., aerated liquid, increased particulates) can cause reading deviations.
Pressure/temperature beyond the measuring range can damage sensors.
Pipeline vibration, corrosion, or scaling may affect signal stability (e.g., plugged impulse lines in pressure transmitters).
(3) Review Recent Operational Changes
Have there been recent valve adjustments, equipment starts/stops, or parameter modifications?
Example: If a control valve’s position changes, it may affect the flow reading without being an instrument malfunction.
Step 2: Diagnose Based on Instrument Characteristics
(1) Understand How the Instrument Works
Instrument Type
Common Failure Points
Typical Symptoms
Pressure Transmitter
Plugged impulse lines, diaphragm damage
No change in reading, erratic signal
Flowmeter
Electrode fouling, liner wear, empty pipe
Zero or fluctuating readings
Temperature Sensor
Broken thermocouple, poor wiring connections
Abnormal readings (e.g., -200°C)
(2) Check Output Signals
4–20mA Loop Check: Use a multimeter to confirm current output.
0mA = possible disconnection
20mA = possible short circuit
HART Communication (for smart devices): Retrieve diagnostic messages like “Sensor Fault” or “Over Range.”
(3) Review Historical Trends
Sudden jumps: May indicate sensor failure.
Slow drift: Could suggest aging, fouling, or environmental changes.
(4) Investigate Environmental Influences
Electrical interference (e.g., nearby VFDs causing signal noise)
Mechanical vibration (causing loose wiring or sensor damage)
High temperature/humidity (damaging electronics)
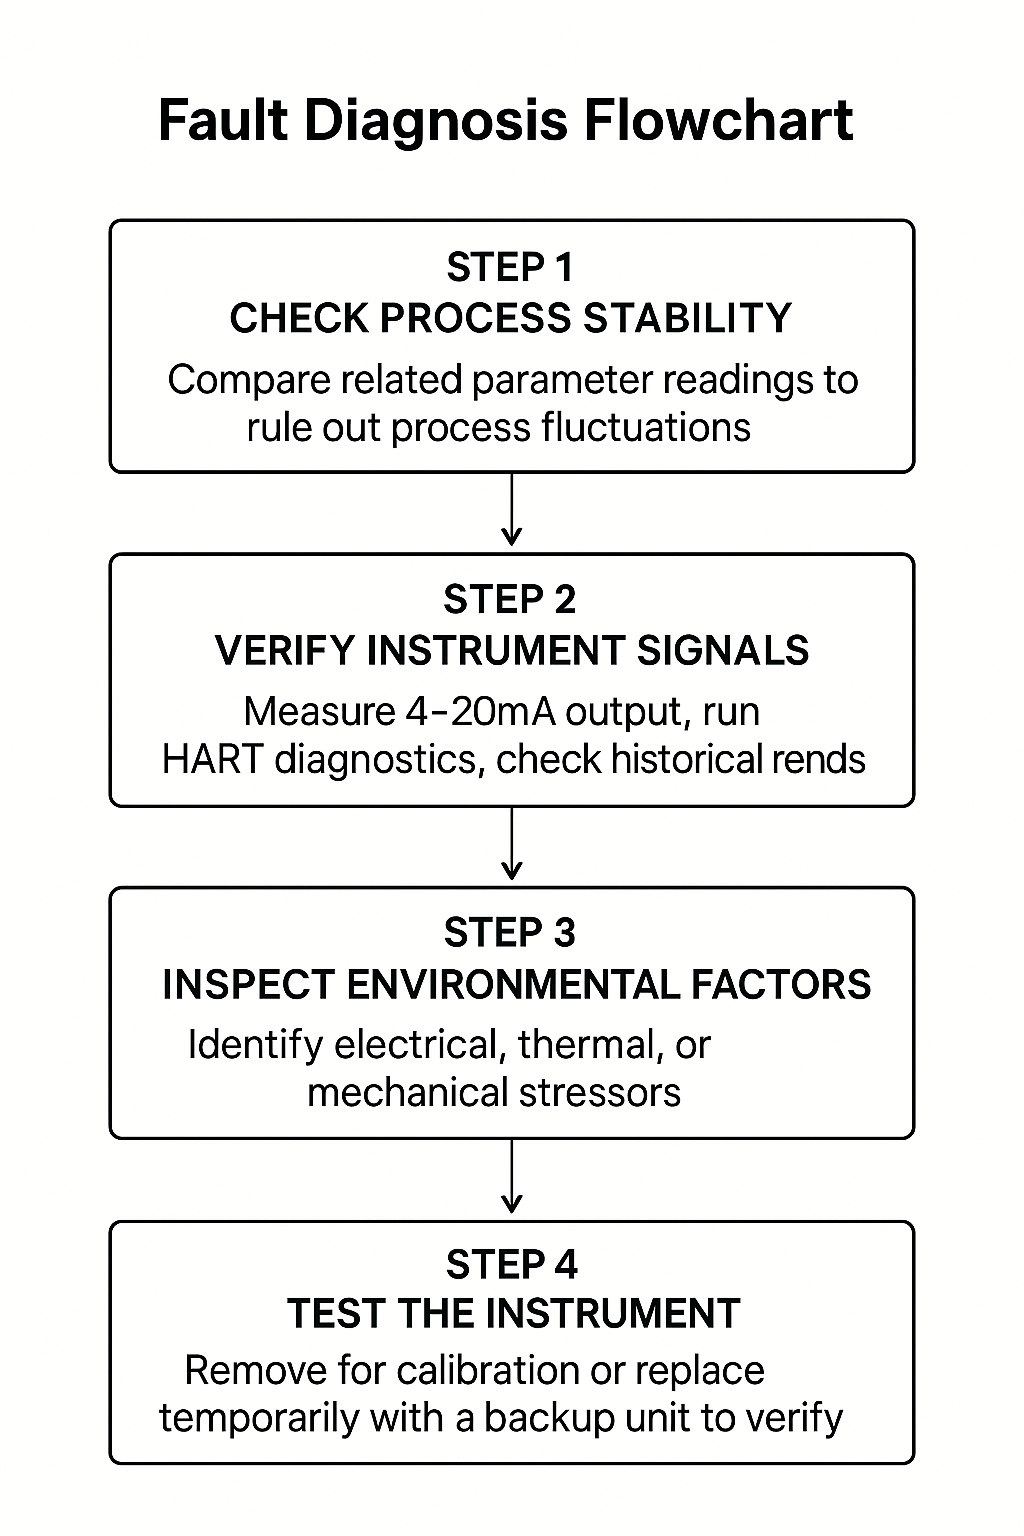
Step 3: Full Diagnostic Flowchart
Check Process Stability Compare related parameter readings to rule out process anomalies.
Verify Instrument Signals Measure 4-20mA output, run HART diagnostics, and check historical trends.
Inspect Environmental Factors Identify electrical, thermal, or mechanical stressors.
Test the Instrument Remove for calibration or replace temporarily with a backup unit to verify.
Case Studies
✅ Case 1: Flowmeter Reading Zero, Process Stable
Possible Causes:
Electrode fouling due to solid particles in the medium
Empty pipe condition (no liquid inside the pipe)
Solution:
Check medium condition
Clean electrodes or reposition installation
✅ Case 2: Fluctuating Pressure Transmitter Signal
Possible Cause:
Water blockage in impulse lines during gas measurement
Solution:
Drain condensate or install drain valves
Key Takeaways
Instrument failure ≠ immediate replacement Always assess process conditions first to avoid misdiagnosis.
Understand vulnerabilities:
Pressure transmitters → sensitive to clogging
Flowmeters → sensitive to empty pipes
Use data & diagnostics: Combine historical trends and signal testing to pinpoint root causes.
✅ Applicable Industries: Chemical, petrochemical, pharmaceutical, power generation, and other process industries.